
Case Studies
Wearable Tech DTC Case Study: Organic Clicks Up About 20.6% Across 88 Days
English content and Guest Posts were planned around key category and product pages. This anonymous wearable tech case study reviews the work, verified publishing records and changes observed in Google Search Console.
01
Client Background and Starting Point
The client is a DTC wearable tech brand selling to overseas consumers through its own website. This case study withholds the brand, domain, specific product names and publishing links that could identify the client.
The work focused on existing category and product pages. Research mapped the questions people search before buying to article topics, destination pages and publishing opportunities. The aim was to create relevant external content about product uses, buying decisions and real use cases.
02
Goals, Scope and Review Periods
The goal was to support priority pages with English content and external references, keep verifiable publishing records and monitor organic clicks, impressions and click-through rate. Topics covered buying guides, feature explanations, comparisons and gifting use cases.
This review uses two separate comparisons. Sitewide results cover 18 June–13 September 2026 versus 22 March–17 June, with 88 days in each period. Page-level results cover 18 June–12 August versus 23 April–17 June, with 56 days in each period.
03
What the Work Covered
- Search intent and topic planning: group brand, category, feature and alternative-product questions into article directions, with a focus on practical buying questions.
- Page and anchor mapping: assign topics, destination URLs and relevant anchor text to category and product pages so readers reach the appropriate page.
- Resource matching: review existing site sections and content topics for relevance, and keep candidate, pending, rejected and published records separate.
- English content and publishing: publish buying guides, feature explanations, use cases and comparisons, then organise the article URLs by batch.
- Delivery records and reviews: record the publishing site, destination page, anchor text, article URL and observation status at the time. Review these records separately from GSC performance data.
04
Verified Publishing Records
The June and July records contain 42 published articles at 42 distinct article URLs across 36 root domains. Some platforms hosted more than one article, so article and domain counts are reported separately. These figures cover only the two batches with detailed records provided.
| Record Batch | Published Articles | Distinct Root Domains |
|---|---|---|
| June batch | 21 | 18 |
| July batch | 21 | 19 |
| Combined, with domains deduplicated | 42 | 36 |
Counts are based on the published status and article URLs recorded in the delivery sheets. Candidate sites and proposed future work are excluded. Historical indexing observations do not establish that every article is currently indexed.
05
Sitewide Results Across Two 88-Day Periods
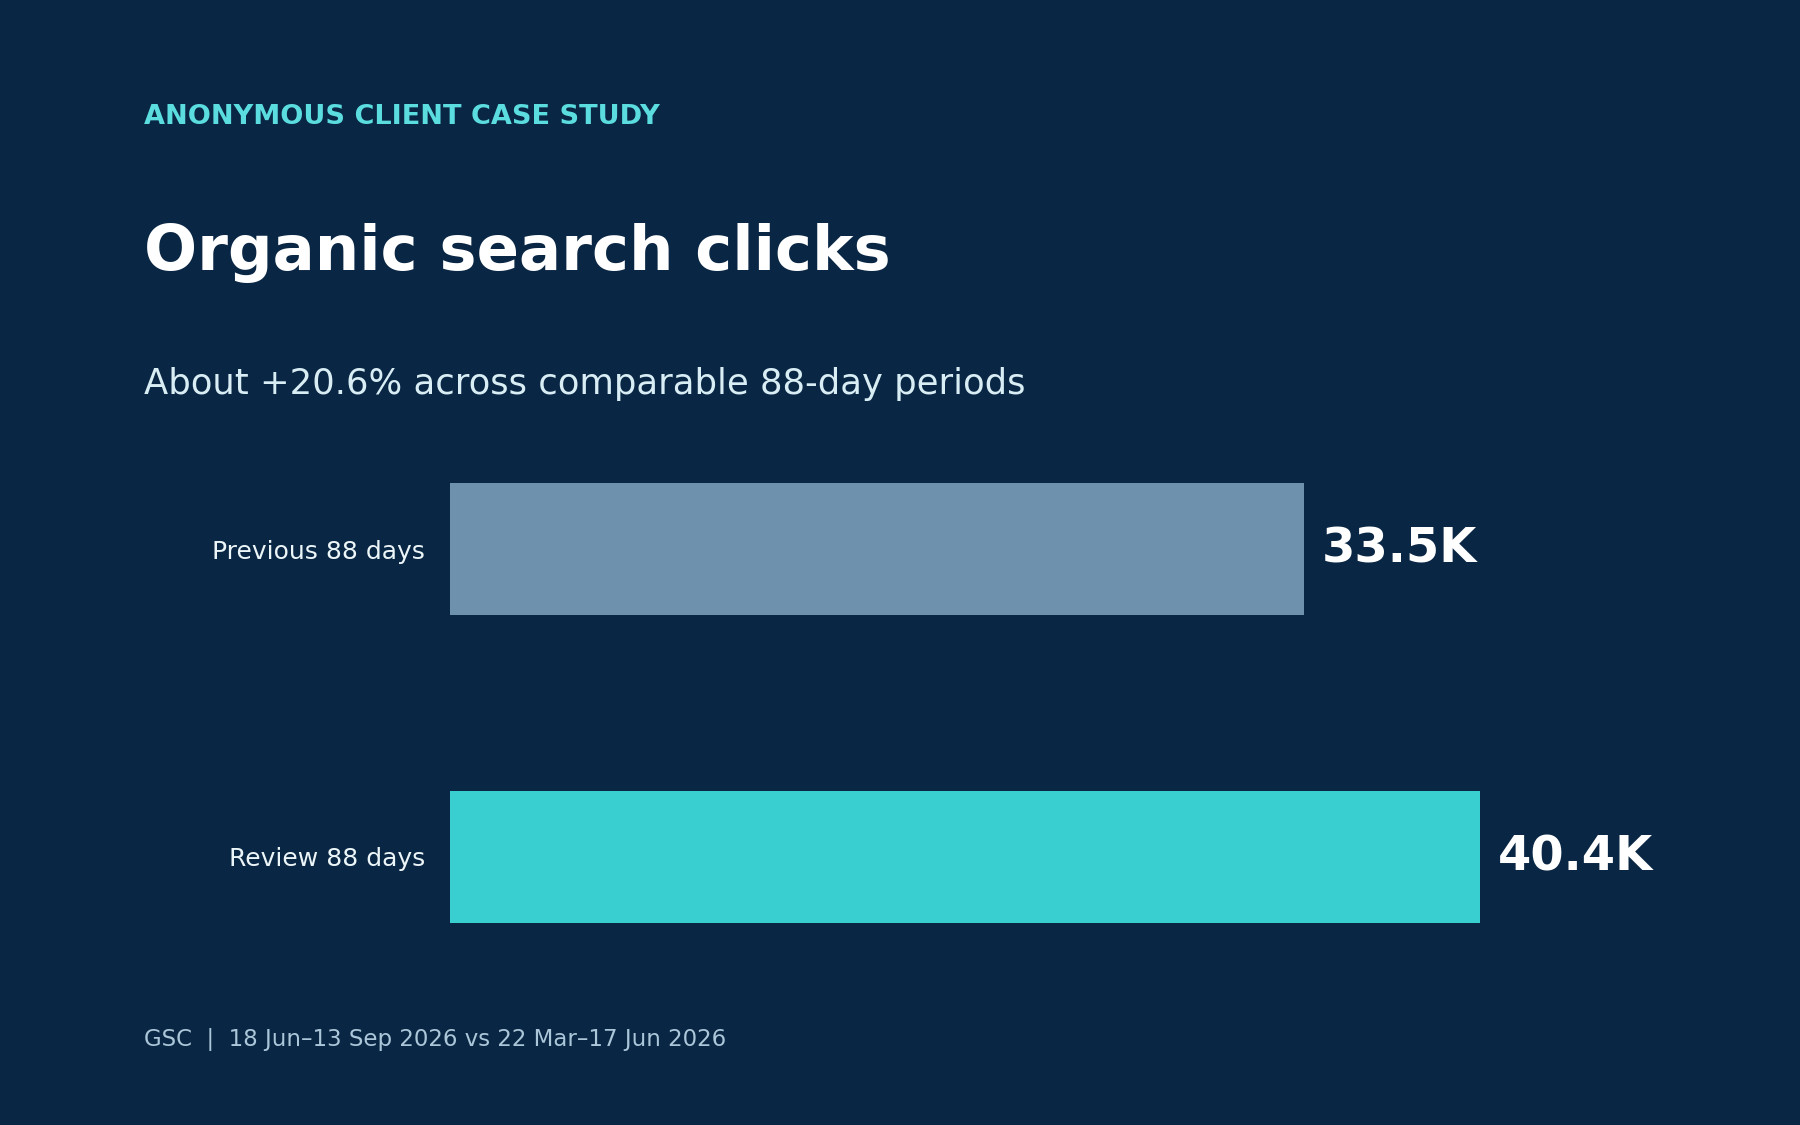
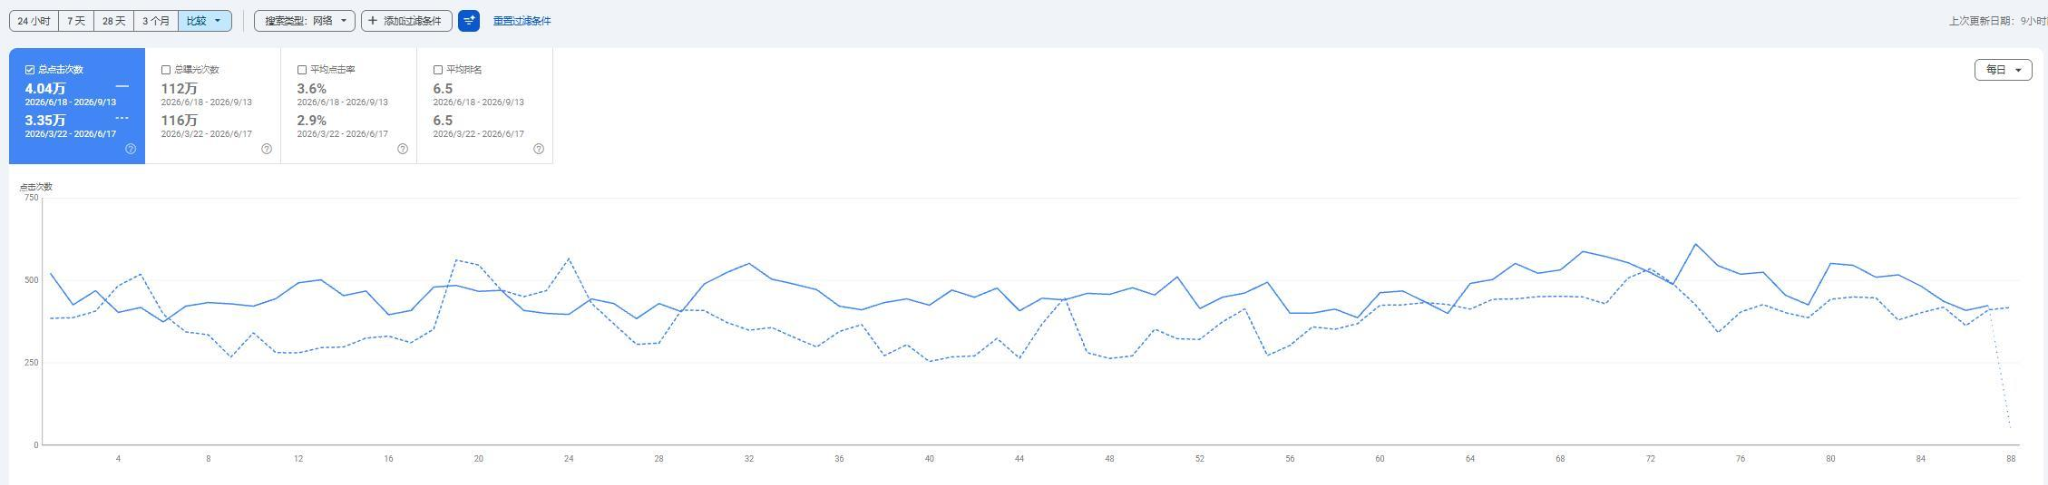
The GSC screenshot shows sitewide organic clicks rising from about 33,500 to 40,400, an increase of approximately 20.6% based on the displayed values. Impressions fell slightly, while CTR rose from 2.9% to 3.6%. The displayed average position remained 6.5.
| Metric | Previous: 22 Mar–17 Jun | Review: 18 Jun–13 Sep | Change |
|---|---|---|---|
| Organic clicks | 33.5K | 40.4K | About +20.6% |
| Search impressions | 1.16M | 1.12M | About −3.4% |
| Click-through rate | 2.9% | 3.6% | +0.7 percentage points |
| Average position | 6.5 | 6.5 | Unchanged as displayed |
Clicks and impressions are rounded in the screenshot, so their percentage changes are approximate. CTR change is stated in percentage points.
06
Priority Pages Across Two 56-Day Periods
The stage report records click changes for several priority pages. Page-type labels protect the client’s identity. These figures use the separate 56-day comparison and should not be combined with the 88-day sitewide results above.
| Anonymous Page | Previous Clicks | Review Clicks | Click Change |
|---|---|---|---|
| Core category page A | 213 | 1,173 | +450.7% |
| Product page A | 71 | 160 | +125.4% |
| Category page B | 49 | 201 | +310.2% |
Periods: 18 June–12 August 2026 versus 23 April–17 June. Percentage changes are recalculated from the click counts listed in the report.
07
GSC Evidence and Interpretation
The client-provided GSC screenshot below shows sitewide results without the brand, domain or product information. It includes both date ranges, clicks, impressions, CTR and average position.
08
Limits and Next Steps
These figures describe changes observed during the engagement. The available records do not include a controlled attribution test, so the full increase cannot be attributed to Guest Posts alone. On-site content, marketing activity, seasonality and search-result changes may also affect performance. Revenue, enquiries and return on investment are not inferred from these data.
The next phase can expand relevant buying questions and use cases around the priority pages that showed growth, with GSC reviewed over comparable periods. Proposed topics and sites remain plans until publication is recorded.
09
Project Ownership and Sources
This anonymous KennyDTC delivery case is based on the project content plan, June–July publishing records, stage report and client-provided GSC screenshot. Original client materials and identifying links are not made public.
Plan Relevant Links for Your Priority Pages
Share your website, target markets and priority pages. We can review your search performance and discuss suitable topics, publishing scope and delivery.